Table of Contents
1. 基础概念
TensorBoard 是Tensorflow的可视化结构管理工具
2. 可视化基础(tf.summary)
2.1. 得到需要可视化的数据
使用tf.summary类下的子类机以实现如下功能:
1. 将输入的Tensor信息 生成Tensor.proto格式的二进制文件
2. 返回dtype=tf.string,shape=() ,内容为Tensor.proto格式的二进制文件信息(Summary protobuf)的Tensor
2.1.1. 标量
# 1. 记录 标量
scalar_summary=tf.summary.scalar(name, tensor, collections=None)
# tensor: 标量 /一个数 A real numeric Tensor containing a single value
type(scalar_summary)
>>> tensorflow.python.framework.ops.Tensor
scalar_summary.dtype
>>> tf.string
scalar_summary.shape
>>>()
2.1.2. 图片
# 2. 记录 图片
image_summary=tf.summary.image(name, tensor, max_outputs=3, collections=None, family=None)
# tensor:tensor dtype=`uint8` or `float32`;shape=[batch_size, height, width, channels],其中`channels` 只能是 1, 3, or 4.
2.1.3. 音频
audio_summary=tf.summary.audio(name, tensor, collections=None)
# tensor: A 3-D `float32` `Tensor` of shape `[batch_size, frames, channels]`or a 2-D `float32` `Tensor` of shape `[batch_size, frames]`
2.1.4. 文本
text_summary=tf.summary.text(name, tensor, collections=None)
# tensor: a string-type Tensor to summarize.
2.1.5. 直方图数据
histogram_summary=tf.summary.histogram(name, values, collections=None, family=None)
#values: 数字类型的Tensor
# A real numeric `Tensor`. Any shape. Values to use to build the histogram.
2.1.6. 分布图数据
(未确定)
distribution_summary=tf.summary.distribution (记录 数据的分布图)
2.2. 语法糖--快捷操作所有可视化数据
上面的每一个op 都是构建图的一部分,没有会话的执行sess.run 都不会计算
为了会话计算方便,可以把上面所有在默认图中的 summaries op 合并为一个
summary_op=tf.summary.merge_all(name=None)

type(summary_op)
>>>tensorflow.python.framework.ops.Tensor
2.3. 将输出的数据都保存到本地磁盘中
这是一个命令,不是op, 不需要通过sess run运行。
filewriter=tf.summary.FileWriter(file_save_dir_path, graph=None, max_queue=10, flush_secs=120, graph_def=None, filename_suffix=None, session=None)

>>>type(filewriter)
tensorflow.python.summary.writer.writer.FileWriter
执行filewriter命令,会在 file_save_dir_path 目录下 保存一个 events.out.tfevents文件,文件名称为: events.out.tfevents.{time}.{machine-name}
3. 使用Tensorboard
3.1. 安装
通过conda 安装 tensorflow 自动安装 Tensorboard
3.2. 运行
3.2.1. 命令行运行
tensorboard --logdir=<dir_path> --host=<ip>

tensorboard --logdir=g:\code\Projects\AI\Competation\Kaggle\003_MNIST_3\log\train --host=127.0.0.1
3.2.2. jupyter 运行
%%tensorborad
3.3. 注意事项
3.3.1. 字符串的书写
注意 \ 结尾," " /单引号 ''
windows 下 磁盘名称小写
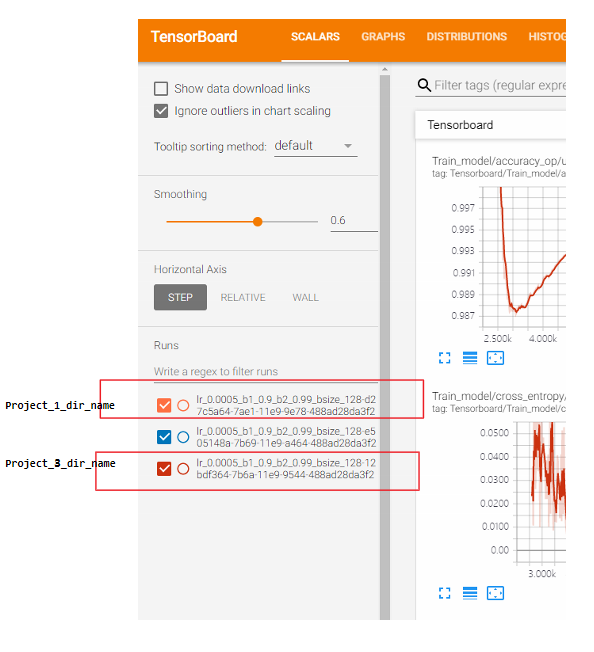
3.3.2. 多项目同时在tensorboard显示
多项目同时在tensorboard显示需要合理设置文件目类结构,正确的文件目录结构<dir_path>如下说明:
--<dir_path>
    |__Project_1_dir_name
    |    |___events.out.tfevents.{time1}.{machine-name}
    |__Project_2_dir_name
        |___events.out.tfevents.{time2}.{machine-name}
若
--<dir_path>
    |__Project_1_dir_name
         |___events.out.tfevents.{time1}.{machine-name}
         |___events.out.tfevents.{time2}.{machine-name}
# 若 <dir_path> 结构不正确,则 出现warning
>>>
Found more than one metagraph event per run. Overwriting the metagraph with the newest event.
4. 可视化进阶
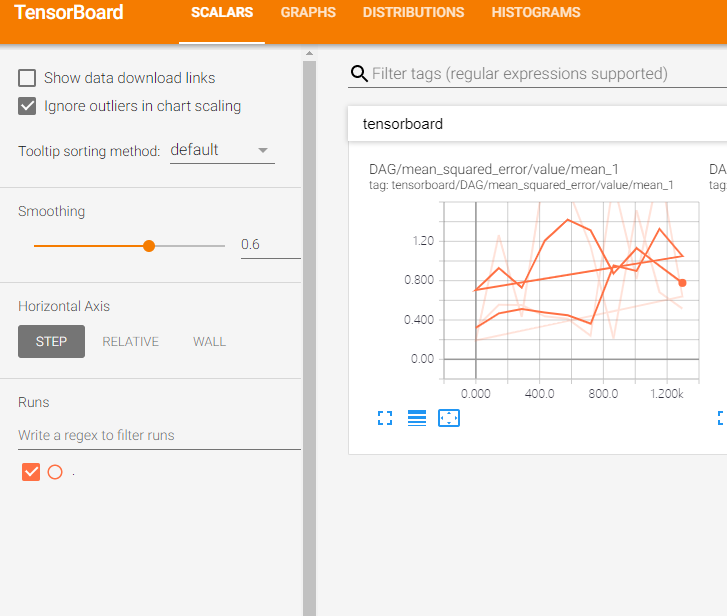
4.1. 同时可视化 Val Train data 数据
summary_writer1 = tf.summary.FileWriter('./log/train', sess.graph)
summary_writer2 = tf.summary.FileWriter('./log/test')
